G’day! In this blog post, I’d like to touch on how Data Analysts can leverage SQL Notebooks (available in Azure Data Studio) to document their analysis, to share their methods / techniques and to collaborate with others so that they can reproduce the analysis and/or they can extend their analysis further.
I’d like to use two examples in this blog: SQL notebook and Python notebook to show case reproducible artifacts created using Azure Data Studio. Before we get started, let’s talk a little bit about Notebooks and then dive straight into the examples.
What is Notebook?
Notebooks are commonly used by Data Scientists, but the use cases have now expanded for Data Engineering and Data Analysts; and with SQL and PowerShell kernels supported in Azure Data Studio we are seeing broader adoption from Database Administrators too!
Tip: Check out Rob Sewell’s blog post for more DBA oriented notebooks, for example PowerShell in SQL Notebooks in Azure Data Studio or Gianluca Sartori’s Generating a Jupyter Notebook for Glenn Berry’s Diagnostic Queries with PowerShell.
Notebook has grown its popularity especially in the Data Science community, largely due to its ability to embed text, code, output from code execution, multimedia and multi-kernels environment. Reproducible research is a common practice for Data Science projects – like any science projects, which usually includes producing document(s) that tie together the research activities and the findings:
- Abstract
- Description
- (Business) Problem statement
- Assumptions
- Hypothesis (i.e. translating the problem statement to scientific statement)
- Data to use
- Methods / approach
- Analysis
- Conclusion including recommended next steps
Notebook originally first started from IPython (Interactive Python) in 2001 which then evolved to Jupyter Notebook in 2014 [source: Wikipedia]. Generally speaking, when the community refers to Notebook, they usually refer to Jupyter Notebook. Azure Data Studio – a lightweight and cross-platform editor for SQL workflows – has adopted Jupyter Notebook in 2018 and continues to tailor the experiences to Azure Data Studio / SQL users.
How to get started
These are useful things to get you started:
- Azure Data Studio (available for Windows, Mac and Linux). Download it here.
- Enthusiasm in trying something new!
Each of the sample files below would have a link to GitHub where you can view the file directly. Or you can also download it / open it directly in Azure Data Studio.
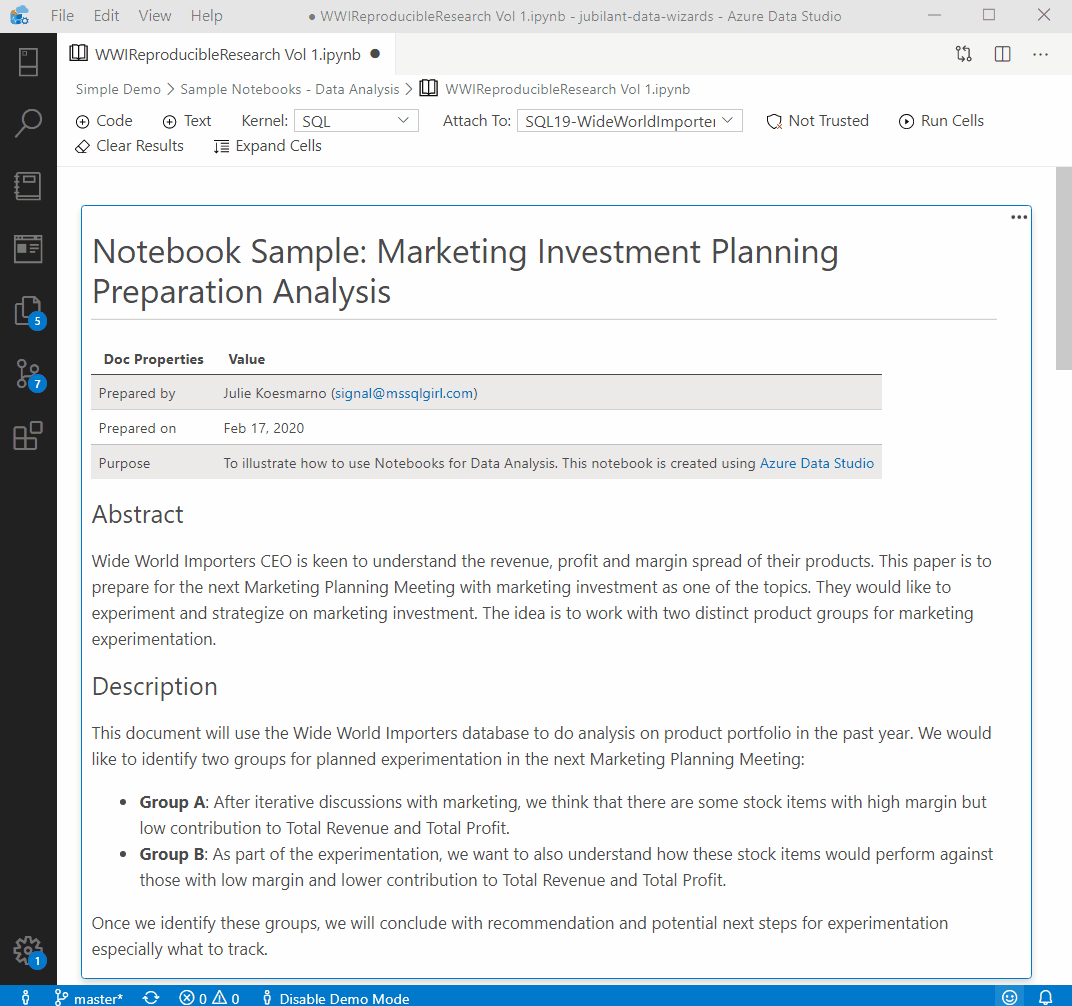
Sample 1 – SQL Notebook
This is a sample SQL Notebook created for Marketing Investment Planning analysis scenario. It identifies two groups for marketing experimentation (created using Azure Data Studio). This outlines how to get the data, the caveats, the approach and the conclusion (including the recommended steps).
Open the sample file in Azure Data Studio using File > Open and copy + paste this path:
https://raw.githubusercontent.com/MsSQLGirl/jubilant-data-wizards/master/Simple%20Demo/Sample%20Notebooks%20-%20Data%20Analysis/WWIReproducibleResearch%20Vol%201.ipynb
See it on GitHub. The cool thing is that GitHub nicely renders the markdown, the SQL queries as well as the result sets!
Tip: The interesting thing about Data Analyst, aka Data Detective (as mentioned in a blog post at AnalyticsVidhya in 2015, and I couldn’t agree more) is that generally your analysis (and your team’s analysis) is build upon one layer of understanding (finding) after another. It is important to keep track of what the original goal was and if it deviates, as long as the analysis is purposeful (instead of just being a data jockey exercise).
Below is a quick snapshot of a SQL Notebook experience in Azure Data Studio. Click on the image to view it in a more readable size.
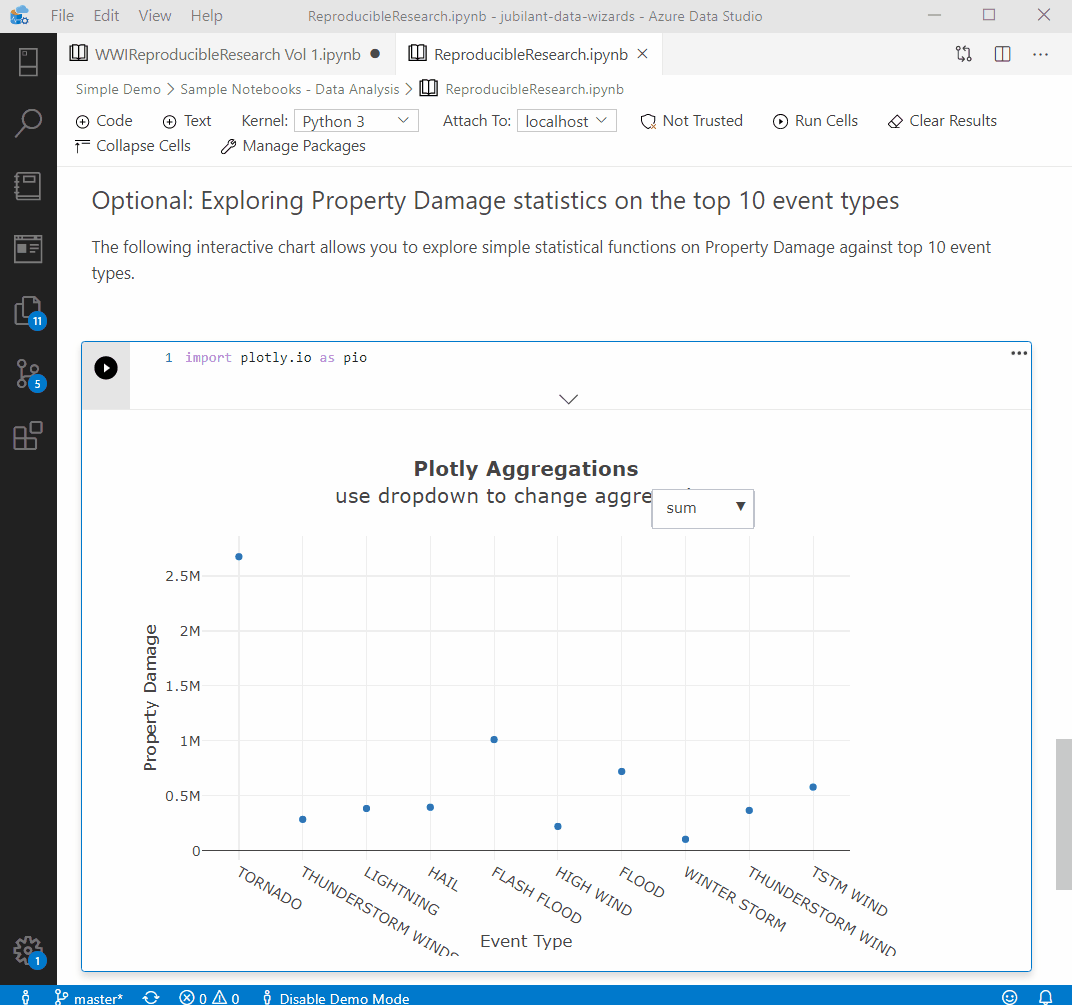
Sample 2 – Python Notebook
This is a sample Python Notebook created for a Data Science assignment to analyze most harmful national weather event. The notebook summarizes the top 10 most harmful events in Notebook (created using Azure Data Studio) and provides interactive data exploratory through visualization in Python.
Open the sample file in Azure Data Studio using File > Open and copy + paste this path:
https://raw.githubusercontent.com/MsSQLGirl/jubilant-data-wizards/master/Simple%20Demo/Sample%20Notebooks%20-%20Data%20Analysis/ReproducibleResearch.ipynb
See it on GitHub. Unfortunately the plotly graphs are not rendered in GitHub (as at Feb 17, 2020).
Below is a quick snapshot of a Python Notebook experience in Azure Data Studio. Click on the image to view it in a more readable size.
Wrap up
Data Analyst role quite often involves investigating data to help business / organization understands what happened. Part of this investigation also involves building a story – and sometimes the story doesn’t end with one analysis exercise – it requires multiple ones and can span across a long period of time. SQL Notebook in Azure Data Studio allows Data Analysts connecting to SQL databases to build the analysis, document the analysis and the story that was shared. It also allows them to collaborate for peer review as well as for others to improve upon the analysis. If you are also savvy in Python (or would like to be), you could also write Python notebook in Azure Data Studio.
Further reading
- How to use notebooks in SQL Server at Microsoft Docs
- PowerShell in SQL Notebooks in Azure Data Studio by Rob Sewell
- Generating a Jupyter Notebook for Glenn Berry’s Diagnostic Queries with PowerShell by Gianluca Sartori
- Using Notebooks in Azure Data Studio by Steve Jones
No responses yet