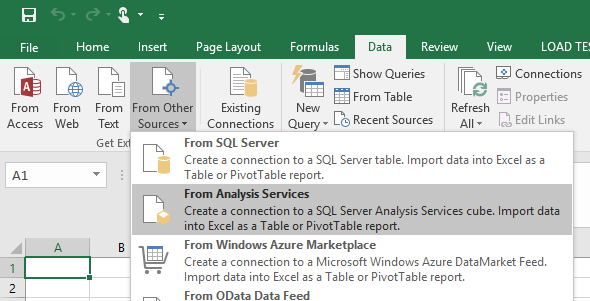
How to connect to your Tabular Model database and use it as the underlying model for either Pivot Table, Pivot Chart, or Power View
Get ready to open your mind to Business intelligence! "Applied Microsoft Business Intelligence" provides best practices on how to leverage Microsoft SQL Server and Microsoft Office for more opitimised BI.
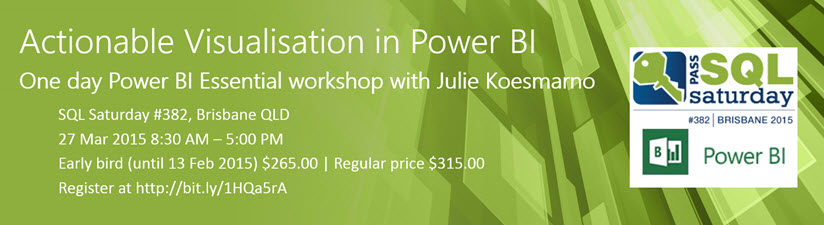
Register now for Actionable Visualisation with Power BI Workshop in Brisbane on 27 March 2015
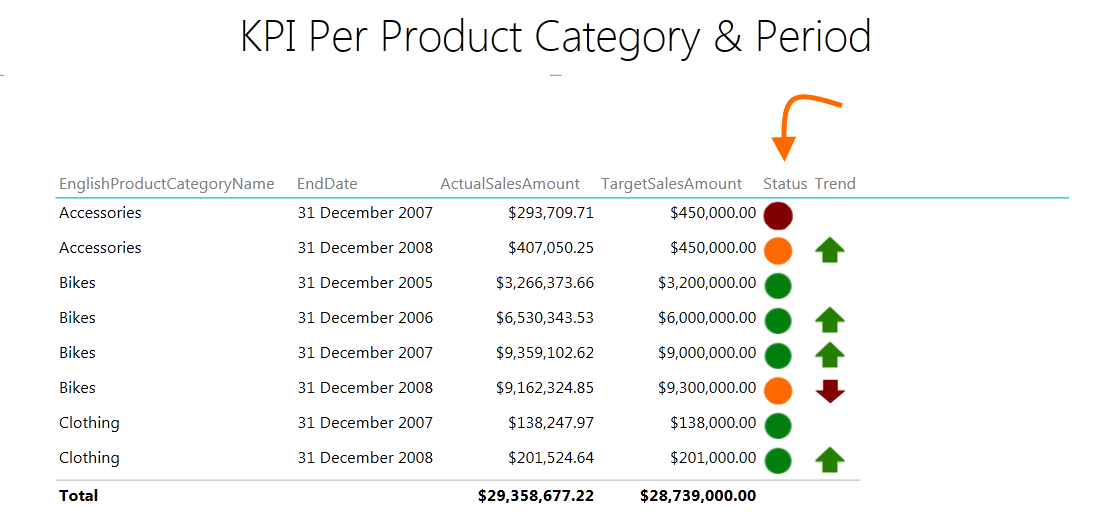
Current Power Pivot / Tabular Model does not support dynamic threshold settings for KPI. However, some customisations on the data model can be applied to enable dynamic KPI threshold in Power View.
Follow up to "I Want It NOW!" Data Visualization With Power View - my 24 Hours of PASS Summit 2014 Preview Session
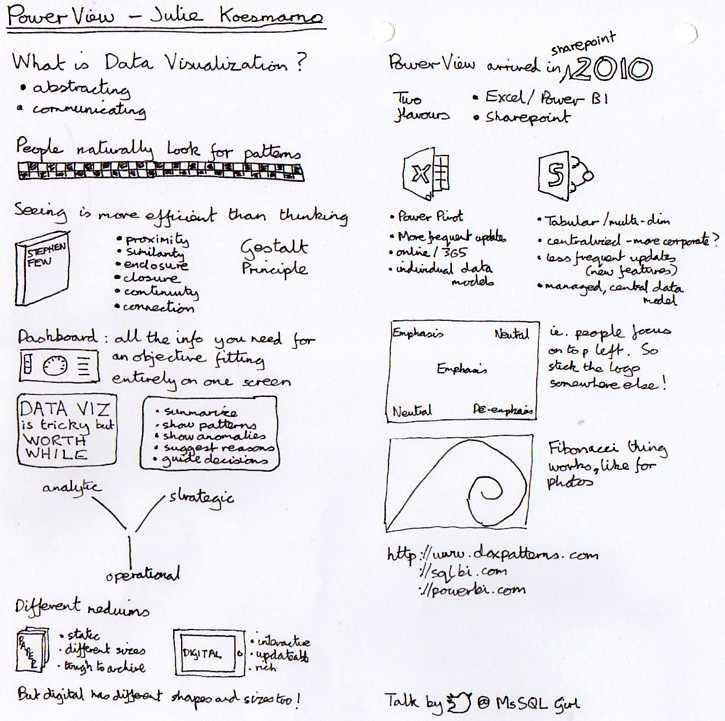
Reviewing Composition of Data Visualisation is as much important as reviewing Objectives of the Visualisation itself. Practice makes better.
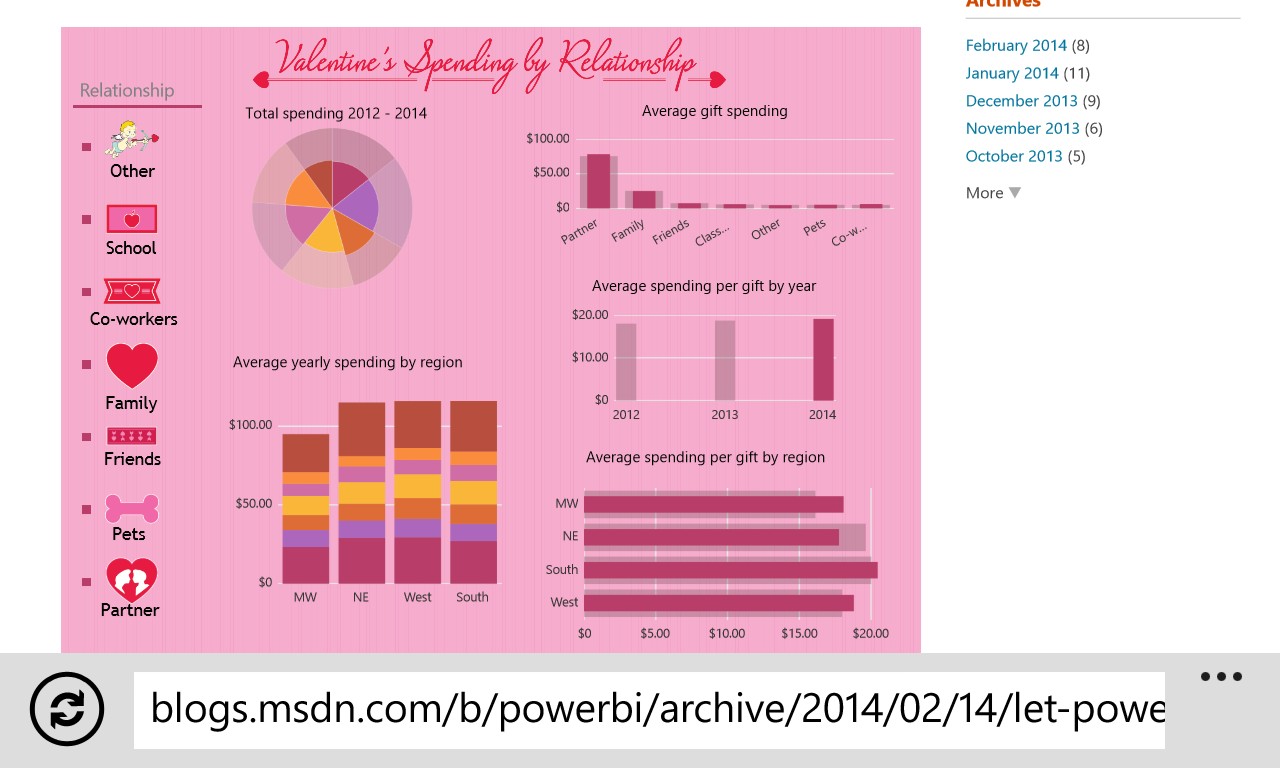
Two recent blog posts from Mcirosoft exhibiting embedded interactive Data Visualisations via Power View, with anonymous access.
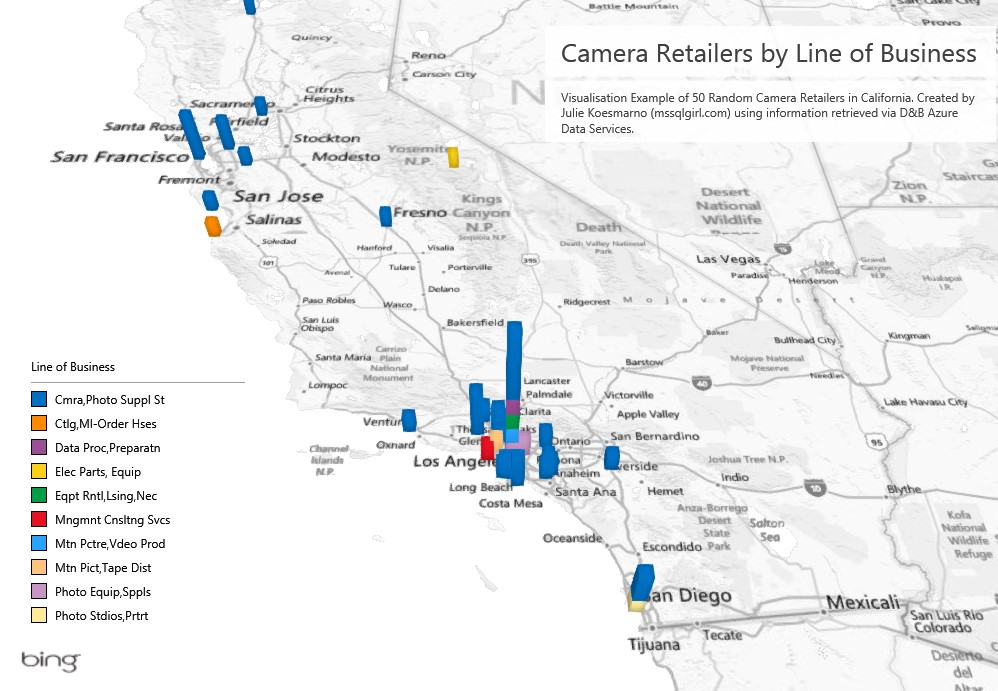
Using Power BI features in Excel, this article showcases D&B Data available on Azure Marketplace.

Speaking at PASS Summit 2013 - From Impaired to Insightful: Analysis with Geospatial Data