Nearly a month ago I presented at 24 Hours of PASS Summit 2014 Preview on “I Want It NOW!” Data Visualization with Power View. The recording is available here. Please note that this is only a preview of what you will see at PASS Summit. So, I sincerely hope that you can join me in person at the Summit.
A heartfelt thank you to attendees who provided the feedback, to organisers, to volunteers and to sponsors. Also a special thank you to Cathrine Wilhelmsen (b | t) who was the moderator at my session. This blog post is to follow up some of the questions that I did not have time to answer during the live session.
Q & A
1. What single killer feature do you think is currently missing from the MS Visualisation stack?
When this was asked during the session, I misunderstood it and thought that the question was referring to Power View only.
To address the question properly, the single killer feature that I think is missing from MS Visualiation stack is a consolidated visualisation. We currently have Performance Point, Power View, Excel Pivot Table / Charts and SSRS. Depending on the specific needs, your choice of the tool is limited based on specific features. As an example, if you want decomposition tree, you would need to have Performance Point in SharePoint; if you want powerful data driven subscription and parameterised reports, SSRS is the best way to go, etc. If it is possible to consolidate the key features of each tools into one – or share more of these key features in the reporting / viualisation tools, it would be great. e.g. having decomposition tree and parameterisation possible in Power View. This is just a small example that I could think of right now but there are many out there. Hoping to hear more about it here.
2. Who would normally be expected to create these kinds of reports? a BI specialist/administrator or the manager/analyst who knows (or thinks they know) what they’re looking for?
Power View is intended for any one who understands the business domain quite well to be in the creation process. They may or may not know what they are looking for right away, on the spot, but through rich interactive and visualisation, the creator could then create a targeted visualisation to curate a story (or more) using Power View.
3. I wouldn’t be comparing “Seeing” and “Thinking”..rather I would do “Seeing” and “Visualizing”.
Yes, that’s a valid point. I am comparing “Seeing” and “Thinking” as they are more appropriate for introduction to how the brain functions. Powerful Visualisation can be generated by taking advantage of the way seeing and thinking parts of the brain work together.
4. Can we create the sub-report in Power View as in SSRS report. Aslo what about the dynamic cascading parameters ?
Unfortunately no sub-report in Power View. When you perform a filter, Power View allows cascading affect to other filters.
5. How do you integrate Excel2013 ( PowerView etc.) with SharePoint 2010 on an existing installation? are there any available documentation?
You would use Excel Services as alluded here. This documentation refers briefly about it and in SharePoint 2013. I have not tested it myself for SharePoint 2010 though. I’d love to hear feedback from people who have had experience around this space.
Additional Notes
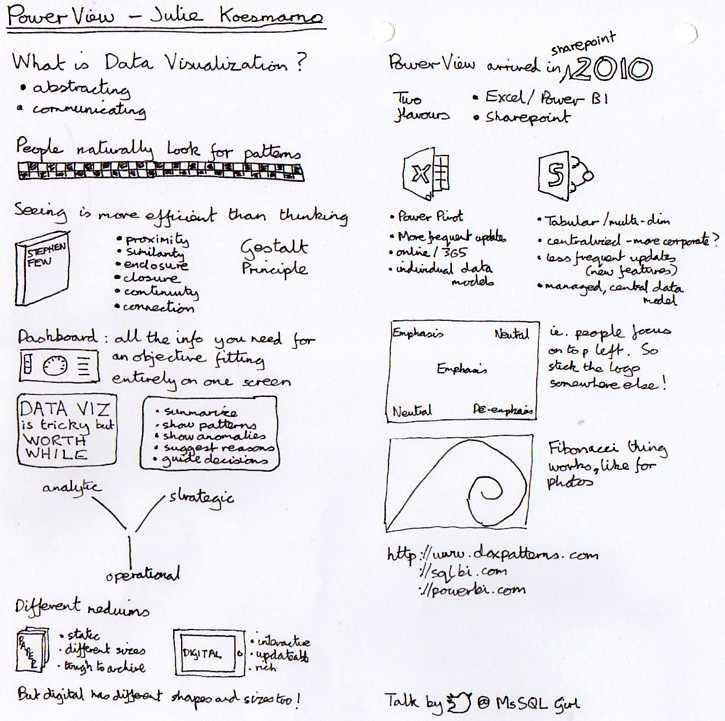
A big thank you goes to one of the attendees, Matt Penny (t), for sketching up notes on the session and sharing it with us. I have seen Matt writing notes in this style for a couple of 24 HOP events now. Pretty cool!
Hope to see you at PASS Summit 2014 in a few weeks!
Julie

No responses yet