This article offers a gentle introduction to Dun and Bradstreet (D&B) Data services on Azure Marketplace. Using only Excel 2013 Power BI, you can perform ETL on the D&B data with Power Query, create reports with Power View and generate 3D visualisation with Power Map for story telling. There will be a second post outlining steps to perform data mashup using Power Query.
Let’s get started with a couple of D&B Data available on Azure Marketplace that are used in this series of Power BI posts.
D&B Data on Azure Marketplace
Recently I have been invited by D&B to review a number of their Data Services on Azure Marketplace. At the time of writing, there were 10 data services provided by D&B. The two that I find quite interesting are:
Company Cleanse & Match for Microsoft SQL Server Data Quality Services
Despite its name, the Company Cleanse & Match for Microsoft SQL Server Data Quality Services is not specific for Microsoft SQL Server Data Services (DQS). For the remaining of this article, I am going to refer to this particular data service as Company Cleanse & Match.
By using the Company Cleanse & Match, you would be able to retrieve more information including Duns Number, Address details, the Confidence level of the matching against the input specified and a few other columns. Based on the current specification, minimally you would need to have the following information:
- Company Name
- Country
- Maximum Suggestions (the number of suggestions to be returned by the D&B service)
- Minimum Confidence (the minimum confidence level for matching)
- State
In simpler words, this offering is a sophisticated way of searching companies online, such as local restaurants. After using it for a while, it is more useful than what it first appeared to be as it also provides DUNS Number. D&B introduced DUNS Number, a numbering system back in 1963 to support D&B’s credit reporting practice. The number is key to most business owners based in US for company identification as well as applying for credit (Source: sba.gov.au)
Company Firmographics – Industry and Sales
The Company Firmographics – Industry and Sales, based on the current specification, is more useful, if you have DUNS Numbers of the companies you want to search for. Not only, the service provides the complete address (Mailing and presumably physical address), it also provides other information such as the total number of employees, the legal status, the year company started, the line of business, Industry Code and more.
Using the data generated by the queries from Company Cleanse & Match and Company Firmogrpahics, you could create insightful story / visualisation just using Excel.
Visualisation Example
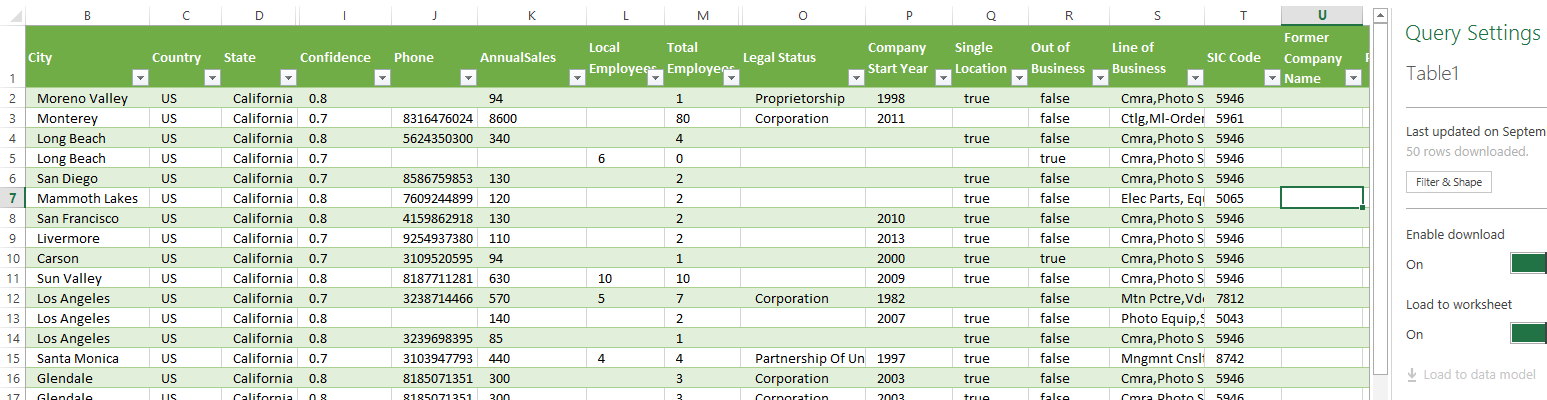
In this example, I use both Company Cleanse & Match and Company Firmographics to retrieve business details of 50 random camera related companies in California. The basis of the visualisation is the Power Query output from the data mashup. The output is in a table format as shown below.
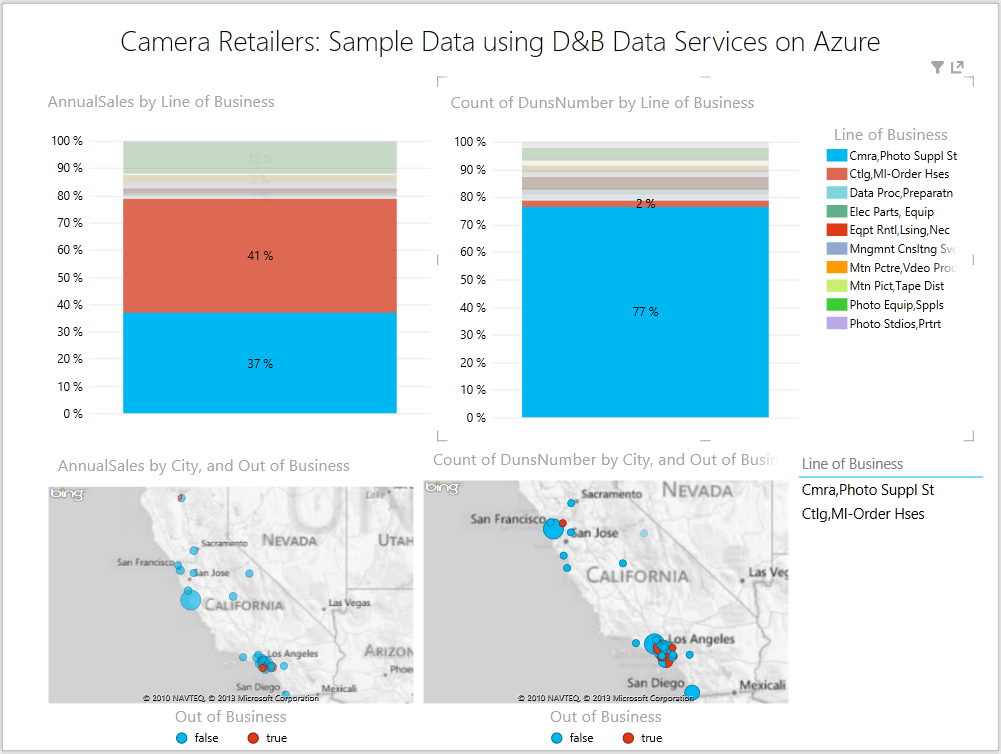
Using Power View, I can generate a simple bubble map as follows to visualise the distribution of camera related companies and their annual sales.
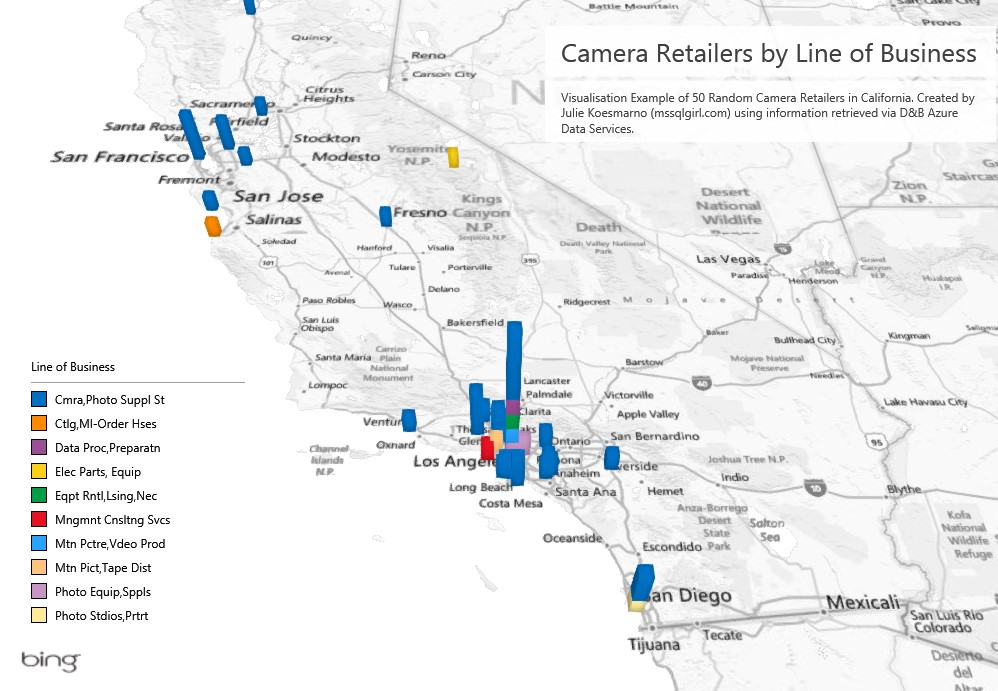
Using Power Map, I can generate two different visualistions as part of a 3D tour. Below is a snapshot of the geospatial visualisation of camera retailers by Line of Business in my sample data.
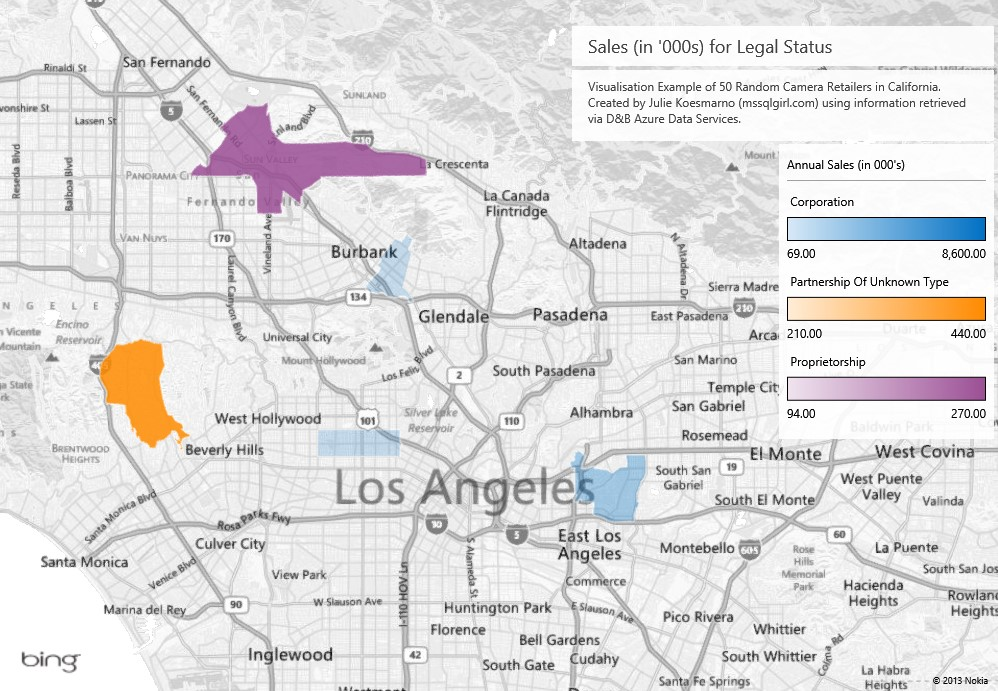
Below is a snapshot of Annual Sales in (‘000s) by Legal Status in the Camera Retailers data.
And just for fun, I have created a 3D tour of the two visualisations to a video, exported directly from Power Map.
Wrap Up
Using data available from Azure, you can perform data mashup to create more insightful information. The information can then be exposed to the different visualisaiton tools of your choice that are appropriate for conveying the story. In this article, we discuss two of the D&B Data Services to get more details of companies and the final visualisation results of the data mash-ups, using nothing but Excel 2013.
Please stay tuned for another post, where I will outline the steps to connect to D&B Data services and performing the data mashup in Power Query
Further Reading
If you are new to Power BI, the following articles are highly recommended:
Power BI for Office 365 Overview and Learning
Power BI Preview Review by Chris Webb
Power Map Preview – Exploring The New Features! by Jason Thomas
More details on Azure Marketplace:
5 Responses
Thanks Julie, this is a great intro write up! I’m becoming your biggest fan. 🙂
Thank you for the kind words, Rocky!
Julie
[…] couple of weeks ago, I posted an introduction to Power BI for data mash up using D&B data. Generally speaking, before you buy anything, you […]
Hi Julie,
We’ve become so inspired by this post that we have published our own dataset on the Azure Marketplace too.
The first ones are all free and consists of a extensive Date dimension as well as a Time dimension, future plans include Currency, Country, Power Data Plus, etc.
Let me know what you think and if it would be useful: http://datamarket.azure.com/dataset/dotlogic/powerdata
Regards,
Pieter (aka @PowerBIRanger)
Hi Pieter,
Thank you for sharing the link 🙂
Julie