Two of the most important times in the year as upcoming and existing SQL Server Community speakers are the submission day for PASS Summit and the Summit days (or shall we say “week”?).
I am one of community speakers – nervous, anxious and excited all at the same time about session abstracts and the opportunity to speak in front of other passionate SQL Server professionals. PASS Summit is more than just a conference for most of us – it’s a gathering for #SQLFamily; we share knowledge, we have fun and we bring back lots of good memories as well as new learning.
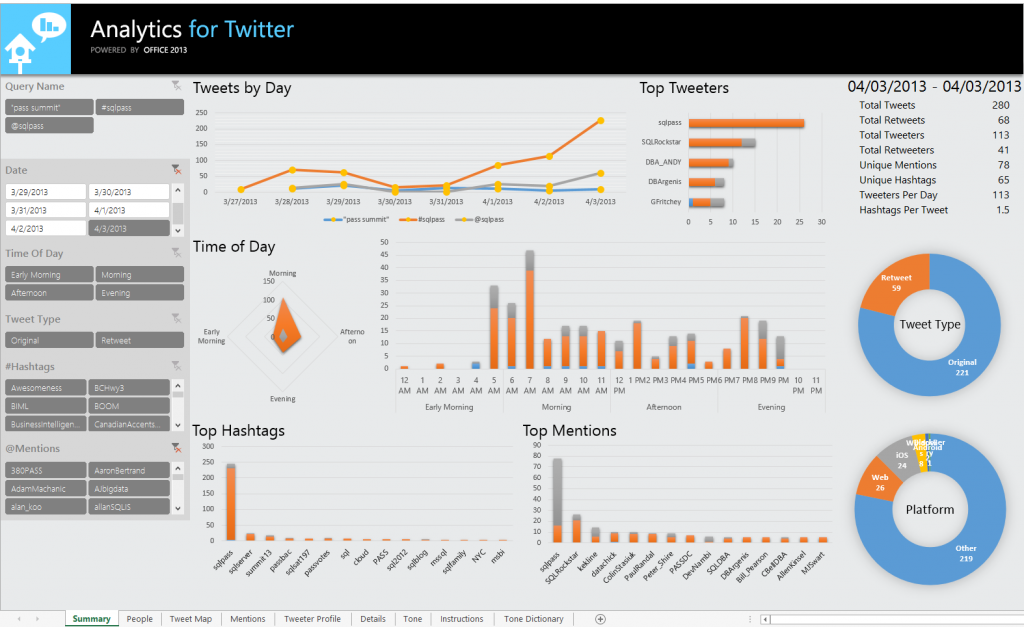
April 3, 2013 9 PM is the big deadline for Community speakers. Using Analytics for Twitter I was able to gather some information on how busy the community was today – discussing SQL PASS and PASS Summit itself. Without further ado, here are the charts.
Let me see!
Analysis based on today’s date up to 9:15 PM (April 3, 2013)
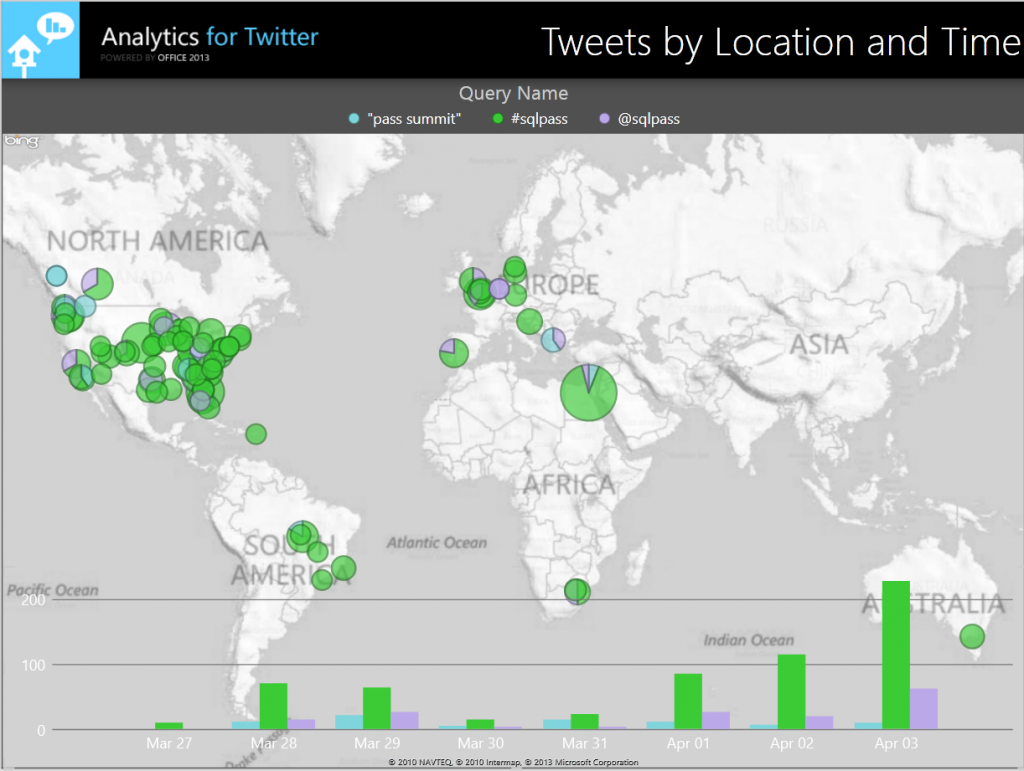
Analysis based on location the past week.
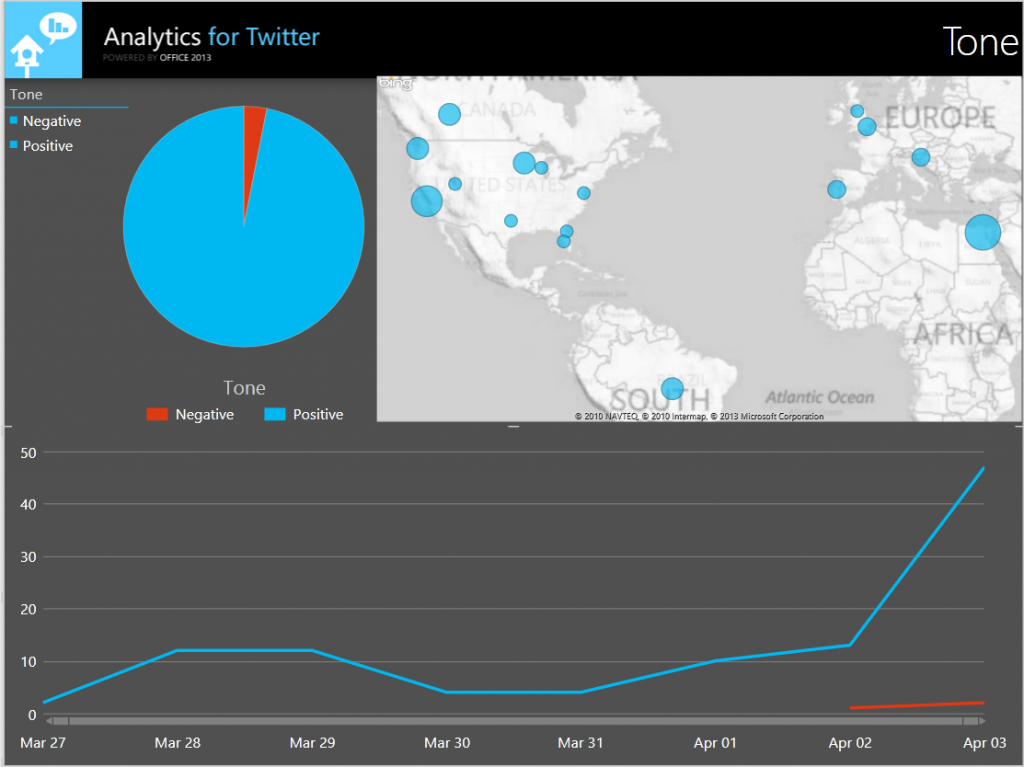
Tone analysis the past week
Note: The time play tone analysis has been replaced with Line Chart instead for easier viewing on the website.
If you are interested in tone / sentiment analysis on social network, below is a good session that cannot be missed at PASS BA Conference on April 10 – 12, 2013. Hope to see you there!
Social Text, Sentiment, and Tone Analysis by Ruben Pertusa Lopez Paco Gonzalez
Wrap Up
Using Analytics For Twitter add-in, we can analyze the buzz around Community Speaker submission for PASS Summit 2013. The submission ended on April 3, 2013 at 9 PM (PST).
I am certain that the conversation about abstract submission will continue for at least another week. Topics discussed will include wishing good luck to other speakers, encouragement, selection announcement, the rules, the system (time out issues), deadline and many others.
I’ll post another article with some more Analytics for Twitter in about a week to follow this up.
Further Reading
Analytics For Twitter on Technet
Analytics For Twitter Download by Extended Results
Social Text, Sentiment, and Tone Analysis session at PASS BA Conference, 2013
Now What? by Colin Stasiuk


4 Responses
This is really cool! How difficult is it to setup Twitter Analytics? What all is needed behind the scenes; do you need a local databases, etc, or is everything ‘in the cloud’?
Hi Steven,
Thank you for visiting!
It’s very easy. Analytics for Twiter installs as an add-in to Excel and also includes the workbook that contains all the charts. All you need to do is type in the hashtags, keywords or twitter handle that you would like to search in the provided workbook.
The data is extracted and stored into PowerPivot as part of the workbook. But it does require manual refresh of data (click “Refresh All” button in Excel) if you want to get the latest results from Twitter. I would recommend downloading the Excel 2013 version if you can, as it has Power View. Essentially behind the scene is just the workbook which contains PowerPivot, charts and tables within the workbook for configuration, as well as the dlls for the add-in.
You can also modify the charts or add new ones, once you understand the data model. So, it’s very flexible!
Hope this helps! If you have any questions, let me know.
Stay tuned for Part 2!
Julie
[…] Source: https://www.mssqlgirl.com/twitter-analysis-on-pass-summit-2013-part-1.html […]
[…] Source: https://www.mssqlgirl.com/twitter-analysis-on-pass-summit-2013-part-1.html […]